Health and safety
Summary
In a typical hour of an average day in the United States
over 1,000 injuries occur that require medical attention (Christophersen,
1989). More than 97,000 Americans die each year from unintentional injuries in
accidents (USBC, 1991). By far the most frequent of these accidental fatalities
involve traffic mishaps-followed by falls, drowning, fires, poisonings, and
firearms. More than 3,000 people die in accidents at their jobs each year, and
thousands of other workers are seriously injured. Industries with the highest
mortality rates include mining and construction businesses, and industries with
the highest injury rates include meatpacking, heavy manufacturing, rubber
recycling, and sawmill companies (USDL, 1987). Government data reveal that accidental injury is~
1. · the fourth most frequent cause
of death in the American population as a whole.
2. · The leading cause of death of
individuals under age 45.
3. · Responsible for over half of all deaths of children and adolescents (Cataldo et al., 1986; Haggerty, 1986; WaIler, 1987).
Another way to see the relative impact of injury versus disease on life is to estimate the years of life lost by the victims of these causes of death. We could, for instance, use the age of 65 as a standard, subtract the age of death of each person who dies earlier, and then total all the years lost to injuries separately from those lost to disease. Calculations like these reveal that the total number of years lost from the combination of unintentional and intentional (that is, murder or suicide) injuries is about the same as from the combination of heart disease, cancer, and stroke--the three most frequent causes of death in America (Chistophersen, 1984; Robertson, 1983; Wailer, 1987). About two-thirds of injury deaths are unintentional.
(Adapted from Sarafino, Health Psychology (2nd Ed), Wiley & Sons, 1994)
Definitions, causes and factors affecting accidents
Accidents are the most common form of death for people under thirty.
Definitions
Pheasant (1991) defines an accident as “ an unplanned unforeseen or uncontrolled event – generally one that has unhappy consequences”.
A dictionary defines an accident as:
· · An event without apparent cause
· · An unexpected event
· · An unintentional act
· · A mishap.
ACCIDENT STATISTICS IN THE UK
Road accidents
During 1999 there were just over 235,000 accidents causing personal
injury, which caused 320,000 casualties including 3,600 deaths. This actually
shows a marked improvement over the last twenty years, as deaths and serious
injuries have reduced by 36 per cent and 48 per cent respectively since 1981
(DETR, 1999).
Accidents in the home
Around 4,300 people are killed each year in home and garden accidents,
and about 170,000 suffered serious injuries that required inpatient treatment
in hospital. Home accidents also led to 2.84 million visits to accident and emergency
departments.
Some accident figures leave
you asking why? and how? For example, according to the Department of Trade and
Industry (DTI, 2001), the number of accidents caused by tea cosies is rising
(up to 37), though sponge and loofah accidents are in decline (down to 787).
They report that the number of people hospitalised after accidents with
articles of clothing is 5945 for trouser accidents and 13,132 for socks and
tights. It is tempting to fill the rest of this page with this data, but I will
leave you with the final observation that more people were injured in 1999 from
beanbags (1317) than chainsaws (1207).
(Banyard 2002)
Accidents at work
Surveys indicate that about 1.5 million people each year are hurt at
work and treated in casualty departments. Many of the injuries are minor and so
are not reported. In 1998/9 there were just under 53,000 major injuries
reported, of which 24,000 were to members of the public (R0SPA, 2001 a).
All in all, there are
millions of accidents each year that require the attention of health workers.
Some of these accidents could be avoided, so it is useful to consider the major
causes and see what can be done to improve our safety.
CAUSES OF ACCIDENTS
In some respects all
accidents are unique, but it is also possible to see some common contributory
causes. Reason (2000) says that the problem of human error can be viewed in two
ways: the person
approach, and
the system approach. Each way has its own model of the
causes of error and suggestions of what is to be done about it. The example
below of giving the wrong medicine highlights these two models.
The wrong medicine
On the afternoon of January
4th 2001, a day case patient at the Queens Medical Centre (QMC) in Nottingham
turned up for his chemotherapy treatment. Under the supervision of a Specialist
Registrar, a Senior House Doctor correctly gave the patient a drug (Cytosine)
directly into the spine. A second drug (Vincristine) was then also administered
by the same route. Unfortunately, this drug should have been given
intravenously, and despite the efforts of the medical staff the 19-year-old
patient died.
How could this happen? How
could two experienced, specialist doctors make what appears to outsiders to be
such a basic error? The inquiry into the accident (D0H, 2001 d) highlights how
professional mistakes (personal causes of error) and the procedures and
equipment (system causes) contributed to the death. It was already known that
there was a danger of giving Vincristine into the spine because it had happened
before. As a result it was part of good practice at the QMC to give the two
treatments — one into the spine and one
into a vein — on different days, but this
procedure was not always followed, especially when patients had a history of
missing appointments. Also, the manufacturer of Vincristine provided labels to
be attached to the syringes which said ‘Not for intrathecal use — For intravenous use only.
However the QMC staff did not use these labels because they believed they had
the potential to confuse people. The inquiry also noted that the syringes for
both injections looked very similar and that the labels were both in black
type.
Although these system
explanations do not explain the accident, they do give some pointers to the
ways in which similar mistakes can be avoided. We will go on to look at some
examples of how the relationship of people with equipment can lead to
accidents.
Accidents
are caused by either:
- Unsafe behaviours or
- Unsafe systems
Roberts
and Holly (1996) list the basic causes of accidents in hospital settings:
- Inadequate work standards:
through a lack of training and supervision.
- Inadequate equipment or
maintenance of equipment
- Abuse or misuse of
equipment, or failure to check equipment.
- Lack of knowledge (for
example in not being able to use equipment correctly.
- Inadequate physical or
mental capacity to do the required job.
- Mental or physical stress
- Improper motivation (e.g.
Dr Shipman)
Deskilling
A source of error in the relationship between operators and machines is the deskilling of the workers. Bainbridge (1987) referred to this as the irony of automation. She pointed out that designers view human operators as unreliable and inefficient, and try to replace them wherever possible with automated devices. Yet this policy often leads directly to an increased number of errors and accidents. The paralysis of the London Ambulance Service, a direct result of the introduction of an automated emergency call routing system in 1993, was a classic example of how this type of problem happens. There are two ironies here: the first is that many mistakes come from the designer’s initial errors — systems are introduced which have not been properly worked out and which are actually unable to do what is required of them. Second, as Bainbridge points out, designers still leave people to do the difficult tasks, which cannot be automated so easily.
Cognitive overload
The study of selective attention
highlights some limitations on our ability to process information. An example
of this problem was reported by Barber (1988), in a description of an aircraft
accident in the area of Zagreb, which was then part of Yugoslavia. A British
Airways Trident collided with a DC-9 of Inex Adria Airways, resulting in the
loss of 176 lives. One of the factors identified as leading to the collision
was the cognitive overload of the air traffic controller responsible for the
sector the planes were flying in.
At the time of the accident
the controller’s assistant was missing, there were eleven aircraft in his
sector, he was in simultaneous radio communication with four other aircraft,
and he was taking part in a telephone conversation with Belgrade concerning two
further aircraft. The controller had received very short notice of the arrival
of the DC-9 into his sector and it appears that the short notice and the
overload of information contributed to the final error. Nevertheless, he was
prosecuted and jailed. This is a graphic illustration of the limitations of our
information processing capacities, and shows that the public response to
disasters is often to blame individuals, when it is the systems within which
the individuals are working which are actually at fault.
Equipment design
An illustration of the problem of equipment design occurred during
World War 11(1939—45), and it came about because the US air force had
concentrated on training pilots to fly aircraft rather than designing aircraft
that could be flown by pilots. They discovered, however, that even very experienced pilots were prone
to make errors with the poorly designed control systems. For example, similar
looking controls operating the landing gear and the steering flaps on some B-25
bombers were placed next to each other. The unfortunate consequence of this was
that several B-25s were brought into land without the landing gear in place,
and so landed on their bellies. The pilots believed that they had activated the
landing gear, but in fact they had just steered the plane (Mark, Warm and
Huston, 1987). Observations like this have led to the development of aircraft
controls that more nearly match the capabilities of pilots.
On a similar theme, some jobs bring their own unique dangers and injuries. For example, football goalkeepers are particularly prone to hand injuries. Most dramatically, there have been a number of injuries caused by the goalkeeper’s hand getting caught on the hooks holding up the net. It appears that a ring can get caught up in the netting and the resulting injuries have required amputation of a finger (Scerri and Ratcliffe, 1994).
Causes of accidents
Most accidents have
multiple causes, though we can divide many of them into two basic categories:
1.
Individual
errors (unsafe behaviours)
2.
Organisational
errors (unsafe systems)
Reason (1990), in his discussion of human error presented a series of case studies of major disasters. In each disaster, a situation was created over a number of months or years, where the systems introduced or neglected by management finally produced a major incident. The incident itself was triggered by the action of one or two individuals and it was these individuals who inevitably got the public blame while the organisation remained relatively unscathed. In his description of the Herald of Free Enterprise ferry disaster Reason (1990) identified ten factors that contributed to the sinking of the ship. He attributed all of them to bad management decisions and design problems, yet it was three sailors who were punished while the management of the ferry owners (P&O) avoided any sanctions.
The diagram explains how an accident may occur (Maurino et al 1995). There are organizational processes that lead to working conditions and to defences and barriers against accidents. An active error occurs when there are local conditions (triggers) that mismatch with the working conditions and with the procedures. Usually, there, are also organizationally produced latent errors when an accident occurs (because otherwise the safeguards prevent an accident even if individuals make errors). Therefore, organizational defences should be strengthened to avoid accidents. Thus, errors may lead to accidents; but we should remember that an organization that attempts to minimize errors might have its own problems because it is too much focused on error prevention.
Case study
Three Mile Island
|
Chain of events and active errors |
Contributing conditions and latent failures |
|
Maintenance crew introduces water into the instrument air system. |
Although this error had occurred on two previous occasions, the operating company had not taken steps to prevent its recurrence. (Management failure) |
|
Turbine tripped. Feedwater pumps shut down. Emergency
feedwater pumps come on automatically, but flow blocked by two closed valves. |
The two block valves had been erroneously left in the closed position during maintenance, probably carried out two days prior to the accident sequence. A maintenance tag obscured one of the warning lights showing that valves were closed. (Maintenance failures) |
|
Rapid rise in core temperature and pressure, causing the
reactor to trip. Relief valve (P05W) opens automatically, but then sticks in
the open position. The scene is now set for a loss of coolant accident (LOCA)
13 seconds into the emergency. |
During an incident at the Davis-Besse plant (another Babcock & Wilcox PWR) in September 1977, the PORV also stuck open. Babcock & Wilcox and the US Nuclear Regulatory Commission investigated the incident. However, these analyses were not collated, and the information obtained regarding appropriate operator action was not communicated to the industry at large. (Regulatory failure) |
|
Operators fail to recognise that the relief valve is stuck
open. Primary cooling system now has hole in it through which radioactive
water, under high pressure, pours into the containment area, and thence down
into basement. |
1 Operators were misled by control panel indications. Following an incident 1 year earlier, an indicator light had been Installed. But this merely showed whether or not the valve had been command shut: It did not directly reveal valve status. (Design and management failures) |
|
|
2 Operators wrongly assumed that high temperatures at the P01W drain pipe was due to a chronically leaking valve. The pipe temperature normally registered high. (Management/procedural failures) |
|
Operators failed to diagnose stuck-open PORV for more than
2 hours. The resulting water loss caused significant damage to the reactor. |
1 The control panel was poorly designed with hundreds of alarms that were not organised in a logical fashion. Many key indications were sited on the back wall of the control room. More than 100 alarms were activated with no means of suppressing unimportant ones. Several instruments went off-scale, and the computer printer ran more than 2 hours behind events. (Design and management failures) |
|
|
2 Operator training, consisting largely of lectures and work in the reactor simulator, provided an inadequate basis for coping with real emergencies. Little feedback given to students, and training programme was insufficiently evaluated. (Training and management failures) |
|
The crew cut back the high- pressure injection (HPI) of
the water into the reactor coolant system, thus reducing the net flow rate
from around 1000 gallons/mm to about |
1 Training emphasised the dangers of flooding the core. But this took no account of the possibility of a concurrent LOCA. (Training and management failures) |
|
|
2 Following the 1977 Davis-Besse Incident, the Nuclear Regulatory Commission issued a publication that made no mention of the fact that these operators had interrupted the HPI. The Incident appeared under the heading of valve malfunction' not operator error'. (Regulatory failure) Source: Reason (1990: 251) |
THE HERALD OF FREE ENTERPRISE
|
Chain of events and active failures |
Contributing conditions and latent failures |
|
The Herald is docked at No. 12 berth in Zeebrugge’s inner harbour, and is loading passengers and vehicles before making the crossing to Dover. |
This berth is not capable of loading both car docks [E and
G] at the same time, having only a single ramp. Due to high water spring
tides, the ramp could not be elevated sufficiently to reach L dock. To
achieve this, it was necessary to trim the ship nosedown by filling trim
ballast tanks Nos. 14 and 3. Normal practice was Lu start filling No. 14 tank
2 hours before arrival. (System failure) |
|
At 18.05 on 6 March 1987, The Herald goes astern from the berth, turns to starboard, and proceeds to sea with both her inner and outer bow doors fully open |
The most immediate cause is that the assistant boson
(whose job it was to close the doors) was asleep in his cabin, having just
been relieved from maintenance and cleaning duties. |
|
Chief officer checks that there are no passengers on G
dock, and tlinks he sees assistant boson going to close doors (though
testimony is confused on this point). |
The chief officer, responsible for ensuring door closure,
was also required (by company orders) to be on the bridge 15 minutes before
sailing time. |
|
On leaving harbour, master increases speed. Water enters open bow doors and Floods into C deck At around 18.27, Herald capsizes to port. |
Despite repeated requests from the masters to the
management, no bow door indicators wore available on the bridge, and the
master was unaware that he had sailed with bow doors open. Estimated cost of
indicators was £400-500. Ship had
chronic list to port. (Management and technical failure) |
Human error
Riggio (1990) identified
four types of error that can lead to accidents:
·
1 Errors
of omission: failing to carry out a task; for example, not closing the bow
doors on the ferry in Zeebrugge harbour
·
2 Errors
of commission: making an incorrect action, for example, a health worker
giving someone the wrong medicine
·
3
Timing errors:
working too quickly, working too slowly
·
4
Sequence errors: doing
things in the wrong order
If we want to reduce accidents, the obvious thing to do is to examine the errors that people most commonly make, and then change the working practices so that the chance of error is reduced. The problem with this is that most workers are reluctant to report errors because of the consequences for them.
The negative
consequences to an individual of reporting a personal error or accident
include:
·
·
time lost
·
·
feeling guilty
·
·
admitting mistakes
·
·
possible disciplinary action
·
·
possible lost confidence of colleagues
·
·
making a mountain out of molehill.
The problems for management
of receiving an accident report include:
·
·
having a written record of the event which increases the danger of litigation
·
·
increased need for action by management
·
·
increased need for investment in people Or equipment
·
·
responsibility is shifted from the worker to the organisation.
Factors affecting individual error
I Substance and alcohol abuse
This is the most commonly cited cause in the literature for accidents, though it is very difficult to get accurate figures because workers are unlikely to admit to having a lunchtime drink.
The most commonly cited cause of accidents is alcohol or substance abuse. When chemicals impair our judgement we are more likely to underestimate the risks of a situation, and overestimate our ability to deal with it. A study of over 500 people attending accident and emergency departments in Scotland examined levels of alcohol (Simpson et a/. 2001). About 25 per cent of the attendees showed signs of alcohol. It was especially noticeable in people attending for reasons of self-harm (95 per cent), collapse (47 per cent) assault (50 per cent), and in those who were subsequently admitted to the hospital (50 per cent). These figures suggest that alcohol might well be a factor in a range of accidents that lead to serious injury. A less well researched area is the effect of prescription drugs on performance. Barbone et aI. (1998) looked at the medical records of drivers in Scotland involved in their first car accident over a three-year period to identify how many had been prescribed psychoactive drugs such as tranquillisers (for example, benzodiazepines) and antidepressants. There were 19,400 drivers involved in accidents in that period, of which over 1,700 were on some form of psychoactive medication, most commonly benzodiazepines. They concluded that users of benzodiazepines had a 60 per cent higher risk of having a first traffic accident and should be advised not to drive.
2 Lack of sleep
Research (for example, Asken and Raham, 1983) shows that (a) errors are more likely in sleep-deprived people and (b) sleep-deprived people need longer to complete tasks.
It is a robust finding from sleep research that sleep deprivation affects people so that they (a) make more errors, and (b) need longer to complete a task (Asken, 1983). One particular area of concern is sleep-related vehicle accidents (SRVAs). A substantial survey of 4,600 UK drivers found that 29 per cent admitted to having felt close to falling asleep at the wheel during the previous 12 months (Maycock, 1996). Sleepiness is brought on by long, undemanding, monotonous driving, such as on a motorway. It is also, not surprisingly, affected by the time of day, as our bodily rhythms affect our level of arousal and alertness. One of the problems for drivers who are feeling sleepy is they are often not aware of dropping off for a few seconds. It is a general finding from sleep research that people who are woken within a minute or two of falling asleep commonly deny having been asleep (Home and Reyner, 1999).
3 Accident proneness
This is controversial, since it stigmatises some individuals, though there is some research that suggests accident proneness can be identified. Jones and Wuebker (1988) describe how a personnel inventory can be used to predict a number of accident-related events. Using the questionnaire they were able to identity high-risk individuals on the basis of their attitudes and personality, and to place them in less hazardous positions, or place them on special safety training programmes.
Other factors that might affect accidents include recent stressful life events, and fear of mistakes.
Factors affecting organisational error
1.
·
the selection of inappropriate staff
2.
·
poor working procedure
3.
·
duty rotas that lead to fatigue
4.
·
an organisational climate that creates poor morale
5.
·
inadequate equipment for the task
6.
·
inadequate levels of training.
Rise in domestic mishaps puts strain
on NHS
http://www.injuryprevention.org/links/links.htm
this gives you
internet links to lots of injury prevention sites and organisations - might be
useful for coursework, or applications in the real world, or just for a good
laugh at the misfortune of others.
http://www.caw.ca/whatwedo/health&safety/awcbc.cfm
this article looks
at behaviour based safety programmes and says "accident proneness" is
a silly concept.
http://www.ucm.es/info/Psyap/hispania/blasco.htm
Ola! this site is a
Spanish one, looking at road safety. Apparently Spain has a big Traffic
Psychology history...and anyone who's ever driven there will understand
why. Good cross-cultural stuff,eh?
http://www.nsms.ws/pages/comm2399.html#Proneness
looks at the
"myth of accident proneness"
http://www.psychology.uiowa.edu/Faculty/Plumert/Research.html#anchor97374
article on child
safety and the causes of accidents. I like the concept of "ability
overestimation" as it reminds me a lot of my boss.
Links researched
by Louise Ellerby-Jones Louisee@westherts.ac.uk
Accidents and alcohol
In Britain the Department of Transport (1996) carried out an analysis
of data on road traffic accidents in which one or more of the drivers involved
either failed or refused a breath or blood test. In 1996 there were 10,850 drink-drive accidents including
540 deaths. Pedestrians who are killed in road accidents are also likely
to have been drinking. In
an earlier report (Department of Transport, 1992), it was estimated that about
half of pedestrians aged between 16 and 60 killed in road accidents had more
alcohol in their bloodstream than the legal drink-drive limit. This fact
is certainly supported in any driver’s experience of travelling through urban
areas after pub closing time at night.
Studies conducted in a number of countries indicate that alcohol is
implicated in many attendances at hospital accident and emergency departments
(Cherpitel, 1993; Waller et al., 1998). Williams et al. (1994) reported that 50% of adults
admitted to a hospital surgery unit with a head injury were obviously drunk.
Alcohol has been shown to play a significant role in deaths from falls, fires,
industrial accidents and deaths from drowning (Eckhardt et al., 1981;
Plueckhan, 1982; Tether and Harrison, 1986).
 Drunk driving is a major cause of death in
the United States: about one-half of the nearly 40,000 deaths each year in automobile
accidents are associated with alcohol use; fortunately, the number of motor
vehicle deaths and those related to alcohol use have declined greatly since the
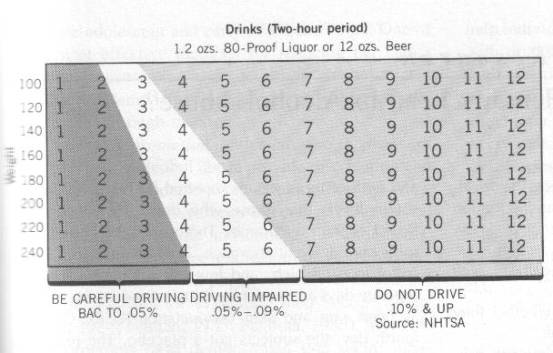
early 1980s (Tolchin, 1993). Consuming alcohol impairs cognitive, perceptual,
and motor performance for several hours; particularly the first 2 or 3 hours
after drinks are consumed. The degree of impairment individuals experience can vary widely from one person to
the next and depends on the rate of drinking and the person’s weight. The table
gives the average impairment for driving—but for some people,
one or two drinks may be too many to drive safely.
Drunk driving is a major cause of death in
the United States: about one-half of the nearly 40,000 deaths each year in automobile
accidents are associated with alcohol use; fortunately, the number of motor
vehicle deaths and those related to alcohol use have declined greatly since the
early 1980s (Tolchin, 1993). Consuming alcohol impairs cognitive, perceptual,
and motor performance for several hours; particularly the first 2 or 3 hours
after drinks are consumed. The degree of impairment individuals experience can vary widely from one person to
the next and depends on the rate of drinking and the person’s weight. The table
gives the average impairment for driving—but for some people,
one or two drinks may be too many to drive safely.
Falling asleep at the wheel
Horne
and Reyner (2001) notes that sleep related vehicle accidents (SRVAs) are a common
form of highway accident, often wrongly attributed to other causes. SRVAs typically
involve running off the road or into the back of another vehicle, with no
braking before hand. Because of the high impact speed SRVAs are often serious. SRVAs peak around 2-6 am and 2-4
pm when sleepiness is naturally higher. Hence, time of day is a critical
factor, as important as the duration of the drive. The author notes that most
SRVAs are not due to sleep pathology. Many are work-related. It is noted that non-sleeping
"rest" is no substitute for sleep. Sleep does not occur spontaneously
without warning, and is preceded by feelings of increased sleepiness of which
the driver is quite aware. Driving impairment is usually worse than is
realized by the sleepy driver. The author concludes that the best
countermeasure for SRVAs is sleep, or even a short nap. Horne,-Jim; Reyner,-Louise Transportation-Research-Part-F:-Traffic-Psychology-and-Behaviour.
2001 Mar; Vol 4(1): 63-74
NO EXCUSE FOR SLEEPING AT THE WHEEL
~~~~~~~~~~~~~~~~~~~~~~~~~~~~~~~~~~~
Falling asleep at the wheel causes 20 per cent of motorway crashes. And
yet, following a sleep-related crash, drivers often deny having felt sleepy
or falling asleep. They could be lying - new research conducted at the
Sleep Research Centre at Loughborough University shows drivers have an
accurate sense of when they're getting tired.
James Horne and Stuart Baulk asked 38 drivers (17 women; age range 20-28
yrs) to limit themselves to five hours sleep the night before they took
part in a two-hour driving simulation task. The participants drove along a
monotonous virtual roadway and stated every 200 seconds how sleepy they
were feeling from "1 = extremely alert" to "9 = very
sleepy". Recording of
their brainwaves by EEG (electroencephalography), of their eye movements,
and a record of lane-drifting incidents provided the objective measures of
sleepiness.
The researchers found a tight correlation between participants' subjective
feelings of sleepiness, their EEG indicators of sleepiness and the
incidences of lane drifting. The authors concluded their "young adult
drivers had knowledge of their neurophysiological level of sleepiness" and
advised "given that sleepiness is a major cause of serious road accidents,
educating drivers about the dangers of driving while sleepy may prompt them
to ask this question of themselves more often, and in so doing, help
prevent such accidents".
Horne, J.A. & Baulk, S.D. (2004). Awareness of sleepiness when driving.
Psychophysiology, In Press.
Journal weblink:
http://www.blackwellpublishing.com/journal.asp?ref=0048-5772
The Sleep Research Centre:
http://www.lboro.ac.uk/departments/hu/groups/sleep/
RAC advice on driving when tired:
http://www.rac.co.uk/carcare/advice/general_help/driving_when_tired
Reading
Philip Banyard (2002) Psychology in Practice – Health, Ch 8, Hodder & Stoughton, 0-340-84496-5